HP Critical Facilities Services | Bethesda, Maryland
Mark Beirne
DLB Associates | Chicago, Illinois
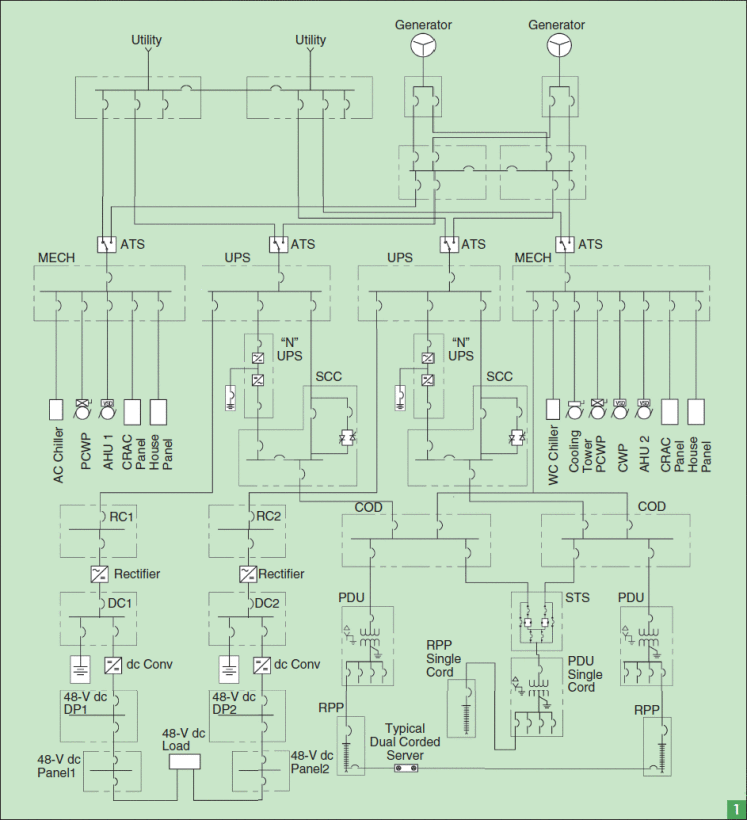
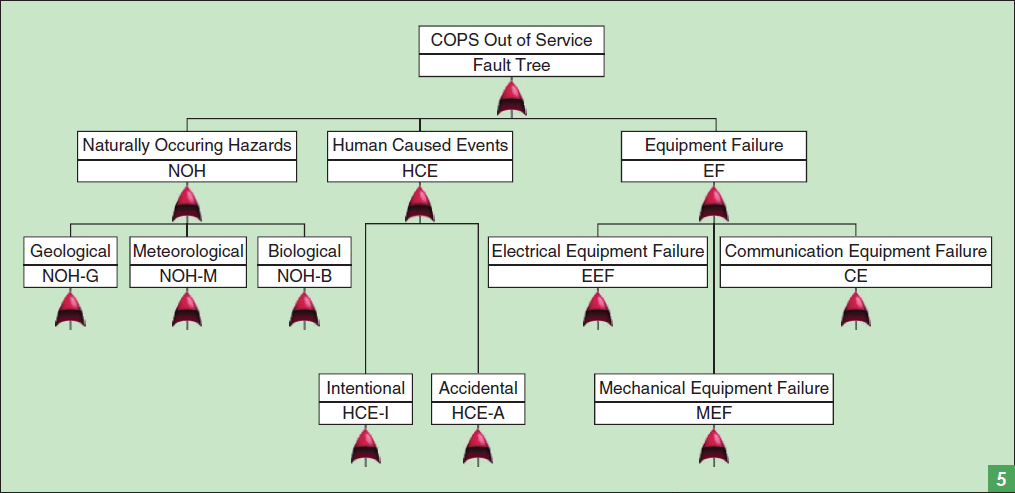
Abstract. The key feature of this article is the application of quantitative method for evaluating risk and conveying the results into a power system design that is scaled according to hazards present in any given emergency management district. These methods employ classical lumped parameter modeling of power chain architectures and can be applied to any type of critical facility, whether it is a stand-alone structure, or a portion of stand-alone structure, such as a police station or government center. This article will provide a risk assessment roadmap for one of the most common critical facilities that should be designated as COPS per NEC 708-a 911 call center. The existing methods of reliability engineering will be used in the risk assessment.
* Robert Schuerger is the lead author on this paper
This content is accessible to paid subscribers. To view it please enter your password below or send mike@standardsmichigan.com a request for subscription details.
Since so much of what we do in standards setting is built upon a foundation of a shared understanding and agreement of the meaning of words (no less so than in technical standard setting) that time is well spent reflecting upon the origin of the nouns and verbs of that we use every day. Best practice cannot be discovered, much less promulgated, without its understanding secured with common language.
It’s actually good to see college kids on Spring Break drinking & socializing instead of playing video games alone in their room on a macrodose edible.
See the clip that caused your grandma to email me & call me a “disgusting person” here: pic.twitter.com/E00Xqx06Wy
Ribollita origin traces back to the Middle Ages in rural Tuscany, Italy, as an example of cucina povera (poor people’s cooking). Peasants and servants repurposed leftovers to avoid waste: after feudal lords ate meals served on large slices of bread (used as trenchers), the soaked, stale bread was collected and combined with vegetables, beans (especially cannellini), and greens like lacinato kale or cabbage. The mixture was boiled, often reboiled the next day with more bread added for thickness, improving flavor and heartiness. This thrifty habit of reheating and extending the dish gave it its name.
This content is accessible to paid subscribers. To view it please enter your password below or send mike@standardsmichigan.com a request for subscription details.
This content is accessible to paid subscribers. To view it please enter your password below or send mike@standardsmichigan.com a request for subscription details.
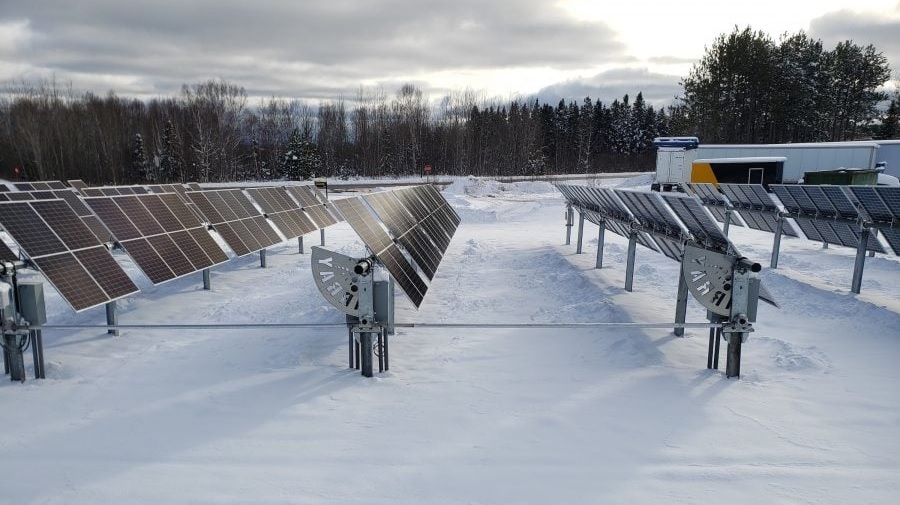
Question: How many households can be supplied with 1 megawatt of power and how large would the solar panel be?
The number of square meters of solar panels required to generate 1 megawatt (MW) of power depends on several factors, including the efficiency of the solar panels, the amount of sunlight available in the location where the solar panels are installed, and the specific technology used.
On average, solar panels have a conversion efficiency of about 15-20%, which means that for every square meter of solar panel area, you can expect to generate between 150 and 200 watts of power in direct sunlight.
So, to generate 1 MW of power, you would need between 5,000 and 6,667 square meters of solar panels (assuming an average efficiency of 17.5%).
There are 2.58999 square meters in one square mile.
To convert 6,667 square meters to square miles, we can divide 6,667 by 2,589.99:
6,667 sq meters / 2,589.99 sq meters/sq mile = 2.572 square miles (rounded to three decimal places).
Answer: Therefore 2.572 square miles of solar panels are required to supply 9345 household of power for 1 hour.
The number of households that can be supplied by 1 megawatt of power depends on a variety of factors, including the amount of electricity each household consumes, the time of day, and the season.
However, as a rough estimate, the US Energy Information Administration (EIA) reports that in 2020, the average US household consumed about 9,369 kilowatt-hours (kWh) of electricity per year, which is equivalent to an average of 0.107 MW of power.
Based on this average, 1 MW of power could supply approximately 9,345 households (1,000,000 watts / 0.107 MW per household) with electricity for one hour, assuming that all households are consuming the average amount of electricity.
Again, this is a rough estimate, and the actual number of households that can be supplied by 1 MW will depend on various factors such as the region, the time of day, and the actual energy consumption of each household.
Discussion: A typical residential lot is one-half acre. Rounding 9345 households to 10,000 households; the households themselves have a footprint of 7.8125 square miles; with 1/3rd of the 2.572 square miles for 1 megawatt taken up by the panels.
Abstract: We address the problem of predicting whether a driver facing the yellow-light-dilemma will cross the intersection with the red light. Based on driving simulator data, we propose a stochastic hybrid system model for driver behavior. Using this model combined with Gaussian process estimation and Monte Carlo simulations, we obtain an upper bound for the probability of crossing with the red light. This upper bound has a prescribed confidence level and can be calculated quickly on-line in a recursive fashion as more data become available. Calculating also a lower bound we can show that the upper bound is on average less than 3% higher than the true probability. Moreover, tests on driving simulator data show that 99% of the actual red light violations, are predicted to cross on red with probability greater than 0.95 while less than 5% of the compliant trajectories are predicted to have an equally high probability of crossing. Determining the probability of crossing with the red light will be important for the development of warning systems that prevent red light violations.
This content is accessible to paid subscribers. To view it please enter your password below or send mike@standardsmichigan.com a request for subscription details.
New update alert! The 2022 update to the Trademark Assignment Dataset is now available online. Find 1.29 million trademark assignments, involving 2.28 million unique trademark properties issued by the USPTO between March 1952 and January 2023: https://t.co/njrDAbSpwBpic.twitter.com/GkAXrHoQ9T