
![]()
![]()


Double the snow weekends, double the fun ❄️ pic.twitter.com/30y6PFa5ah
— The University of North Carolina at Chapel Hill (@UNC) February 3, 2026
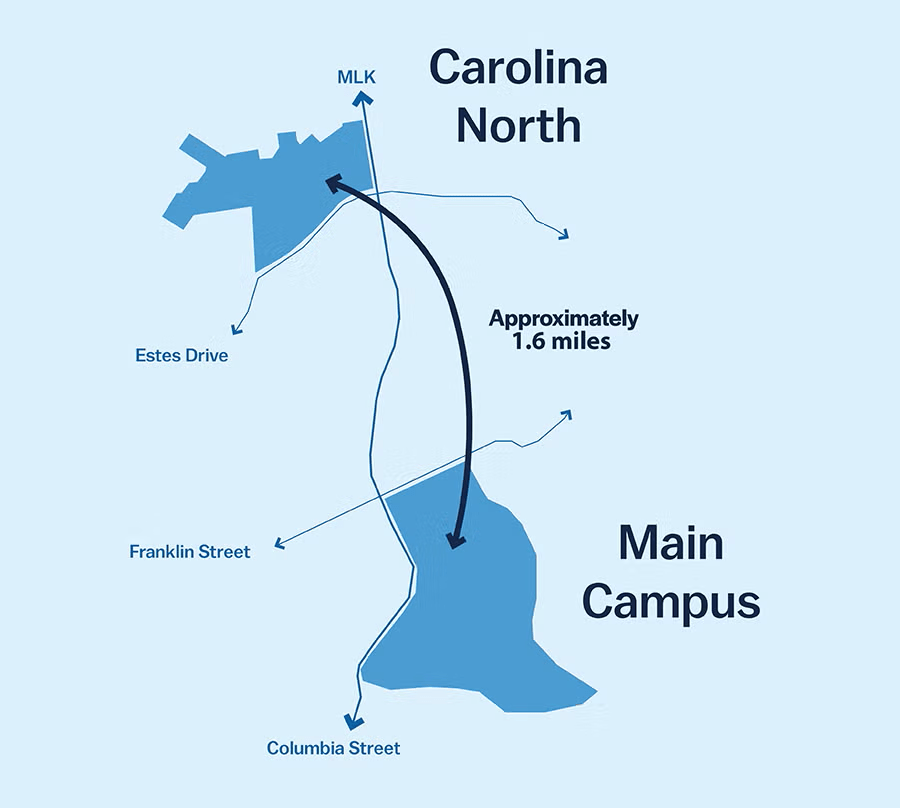
The University of North Carolina at Chapel Hill (UNC-Chapel Hill) is moving forward with Carolina North, a approximately 230-acre satellite campus extension on the former Horace Williams Airport site. Located about 1.6 miles north of the main campus along Martin Luther King Jr. Boulevard, this project is described as the university’s largest development since the cornerstone of Old East was laid in 1793—over 232 years ago.
Announced on January 21, 2026, by Chancellor Lee Roberts, Carolina North is a generational investment to address North Carolina’s rapid population growth (adding over 140,000 residents annually) and support expanded enrollment, housing, and research capacity. It will create a “learn-live-work-play” environment featuring collaborative academic and research facilities (with emphasis on STEM, AI, health, biomedical engineering, and interdisciplinary work), student and family housing, retail, dining, hotel space, civic/cultural areas, public plazas, and improved trail connections to the Carolina North Forest.
Phase 1 Focus
Phase 1 prioritizes approximately 2,200 student beds, academic/research buildings, multifamily residential units, ground-floor retail, and public-private partnerships for vertical development. The project aims to help meet enrollment targets (thousands more students over the next decade), alleviate housing shortages, and expand research space while preserving the historic main campus.
Key Timelines
The long-term, phased approach includes coordination with the Town of Chapel Hill, a stakeholder advisory group, and responsible fiscal planning.
Funding Overview
On January 21, 2026, the Board of Trustees approved $8 million in advance planning spending authority from University Trust Funds for master planning, consultant work, infrastructure design, site assessment, and developer selection.
Full costs are TBD after Phase 1 programming. Future funding will combine:
Official Resources & Documents
Recent News Coverage (January 2026)
As of early February 2026, the project is in early planning with no major updates beyond the January announcement. Check the official Carolina North site or UNC Board of Trustees agendas for the latest developments. This expansion will help UNC better serve North Carolina’s future while honoring its historic roots.
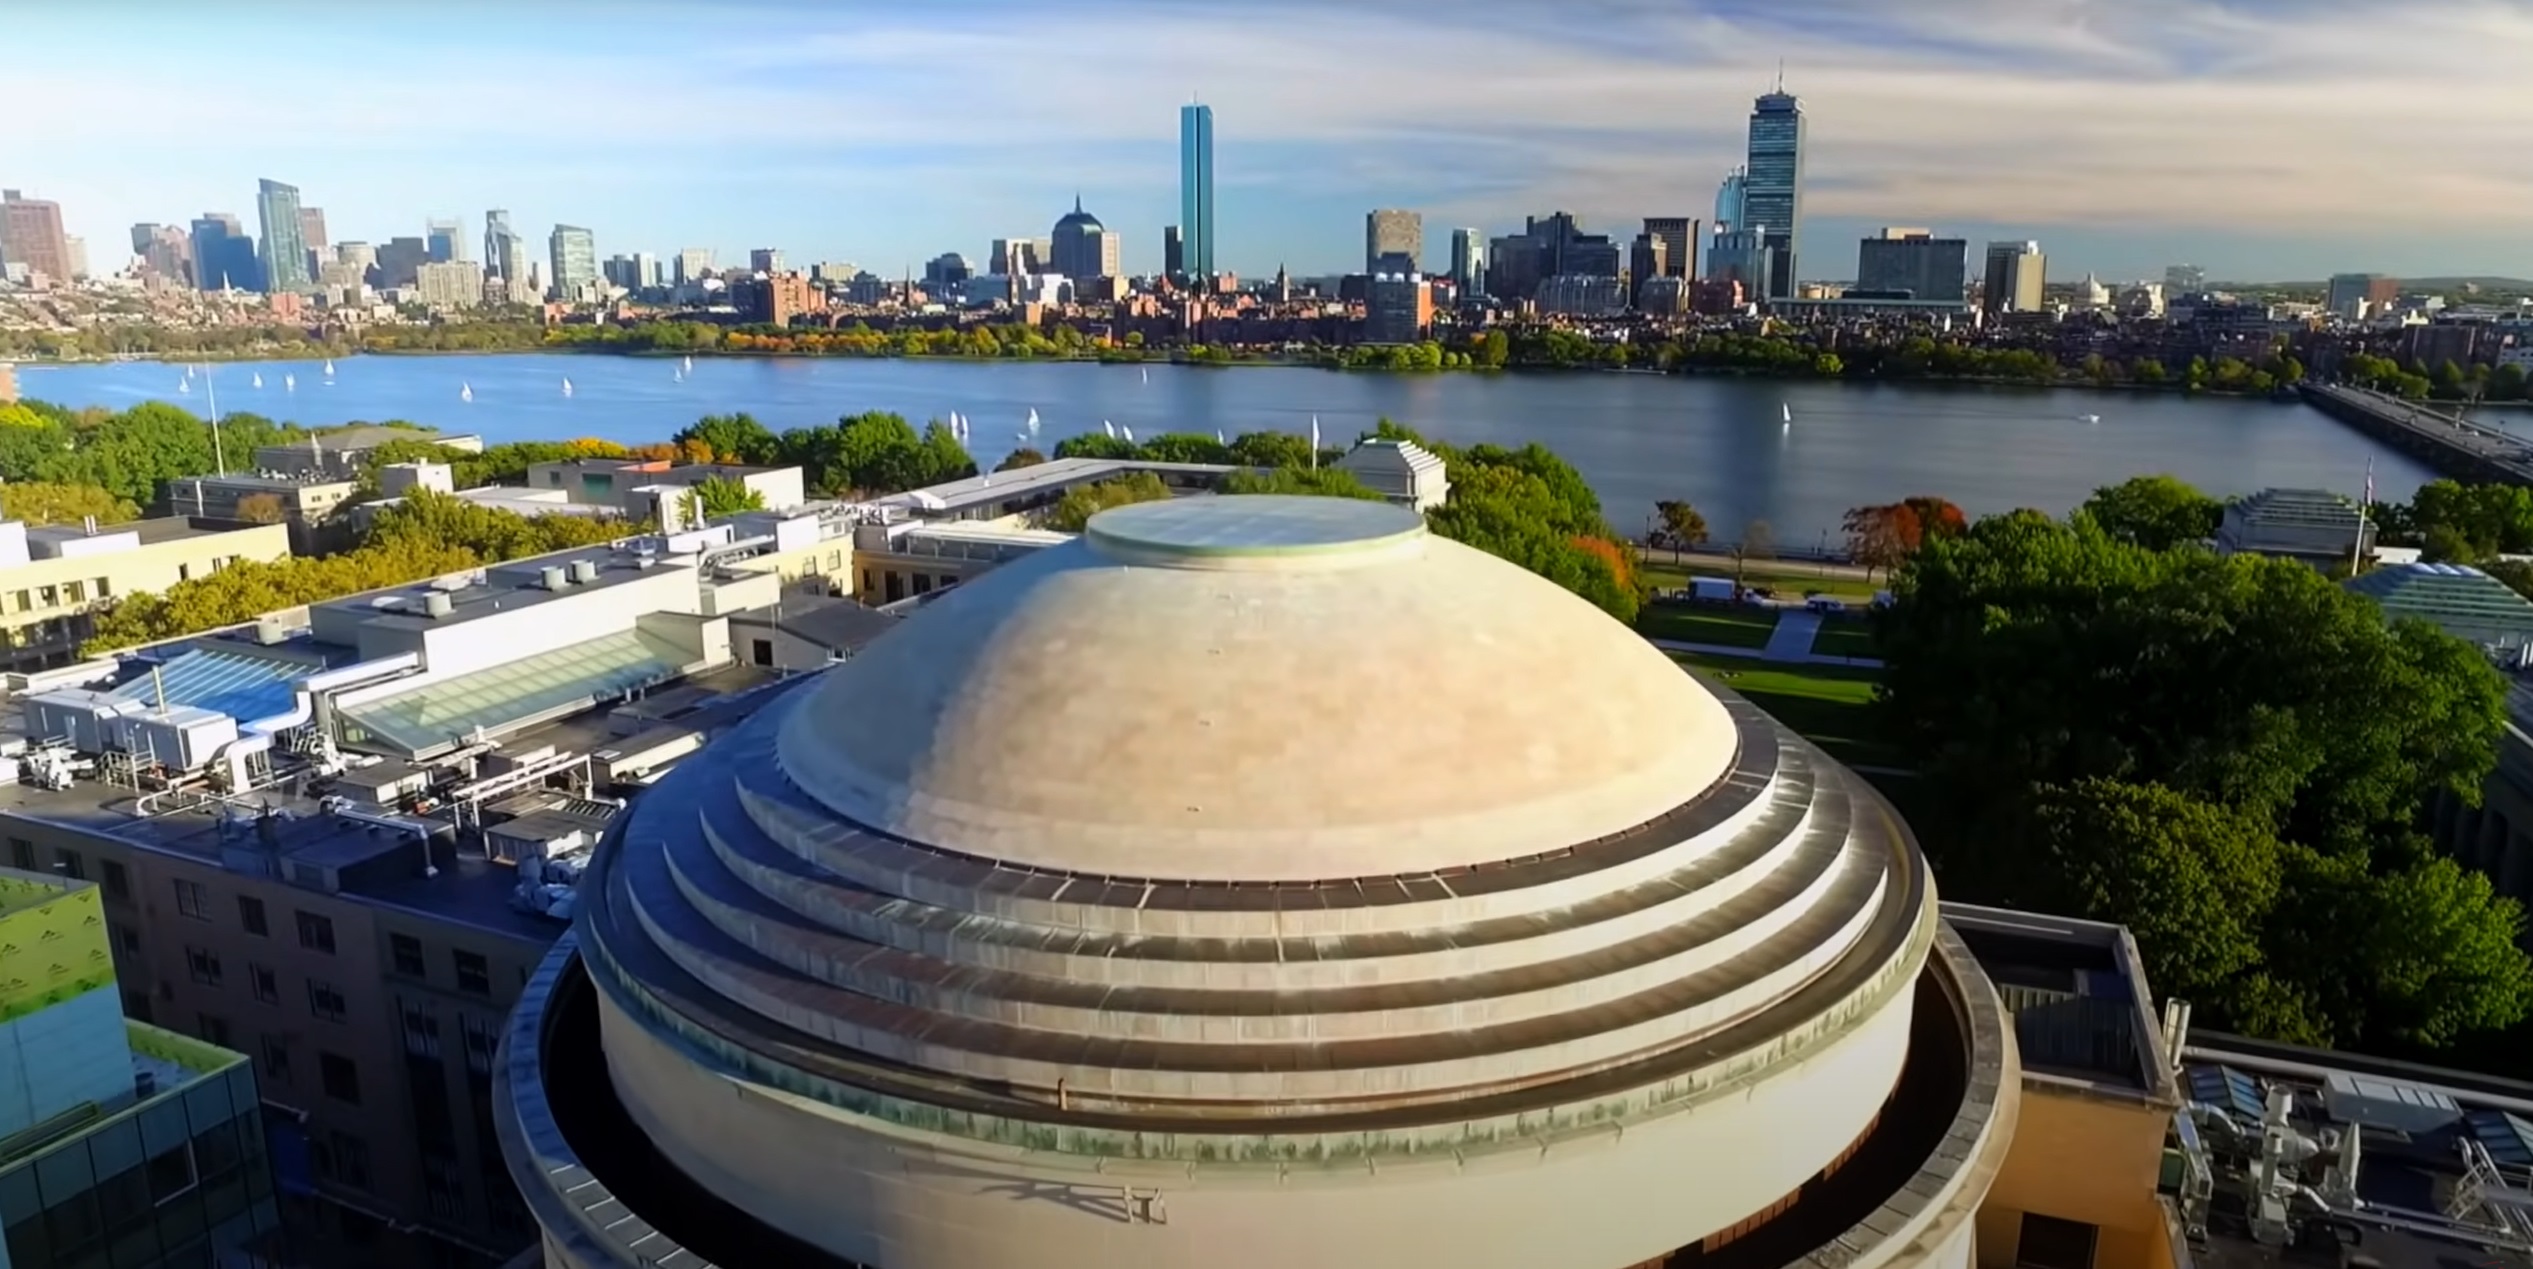
The University of Michigan is developing a major transportation initiative called the Campus Connector, featuring an Automated Transit System (ATS). This proposed system aims to provide fast, reliable, and efficient transit connections between North Campus, Central Campus, and the Medical Campus in Ann Arbor.
The core concept involves an approximately 3.5-mile elevated guideway with automated, electric, rubber-tired vehicles (for reduced noise and vibration), serving around 6 passenger stations. The project is part of the broader Campus Plan 2050, which seeks to reduce car dependency, ease congestion and parking demand, support carbon neutrality goals, and strengthen connections across campuses.
For the latest details, visit these primary University of Michigan sources:
Note: Current bus services already connect the campuses, but the ATS would represent a significant upgrade with dedicated, elevated, automated transit. The project is evolving, so monitor official UMich sites for route finalization, vendor selections, or construction timelines.
Center for Digital Education | University of Michigan
Stochastic hybrid models for predicting the behavior of drivers facing the yellow-light-dilemma
Paul A. Green | University of Michigan
Daniel Hoehener & Domitilla Del Vecchio | Massachusetts Institute of Technology
Abstract: We address the problem of predicting whether a driver facing the yellow-light-dilemma will cross the intersection with the red light. Based on driving simulator data, we propose a stochastic hybrid system model for driver behavior. Using this model combined with Gaussian process estimation and Monte Carlo simulations, we obtain an upper bound for the probability of crossing with the red light. This upper bound has a prescribed confidence level and can be calculated quickly on-line in a recursive fashion as more data become available. Calculating also a lower bound we can show that the upper bound is on average less than 3% higher than the true probability. Moreover, tests on driving simulator data show that 99% of the actual red light violations, are predicted to cross on red with probability greater than 0.95 while less than 5% of the compliant trajectories are predicted to have an equally high probability of crossing. Determining the probability of crossing with the red light will be important for the development of warning systems that prevent red light violations.
![]()
CLICK HERE to order complete article
Transcripts for Today:
CMP-6 Public Input Report: Conductors & Cords, Chapter 9 Tables…
CMP-6 Public Input Report: Branch Circuits, Feeders, Services, Manufactured Buildings….
Use the login credentials at the upper right of our home page.

The pandemic provides background for the importance of ventilation systems in healthcare settings and reminder that there is plenty of work to do. The scope of ASHRAE 189.3 – Design, Construction and Operation of Sustainable High Performance Health Care Facilities — lies in this domain:
Purpose. The purpose of this standard is to prescribe the procedures, methods and documentation requirements for the design, construction and operation of high-performance sustainable health care facilities.
Scope.This standard applies to patient care areas and related support areas within health care facilities, including hospitals, nursing facilities, outpatient facilities, and their site. It applies to new buildings, additions to existing buildings, and those alterations to existing buildings that are identified within the standard. It provides procedures for the integration of sustainable principles into the health care facility design, construction and operation process including:
Noteworthy: Related title ASHRAE/ASHE Standard 170 Ventilation of Healthcare Facilities
Public consultation on Addendum m regarding definition of “room units” and the heating and cooling of such units closes January 27th
Public consultation on Standard 189.3-2021, Design, Construction, and Operation of Sustainable High-Performance Health Care Facilities closes November 11.
We maintain this title on the standing agenda of our periodic Health, Energy and Mechanical colloquia. See our CALENDAR for the online meeting; open to everyone.
October 9 Update
As of the date of this post, two redlines have been released for public consultation
Proposed Addendum L to Standard 170-2021, Ventilation of Health Care Facilities
Proposed Addendum i to Standard 170-2021, Ventilation of Health Care Facilities
The consultation closes October 29th.
Other redlines are released and posted at the link below:
Public Review Draft Standards / Online Comment Database
Because this title is administered on ASHRAE’s continuous maintenance platform, public consultations run 30 to 45 days. You may also submit an original idea to the ASHRAE standards development enterprise. CLICK HERE to get started.
We maintain this title on the standing agenda of our periodic Health, Energy and Mechanical colloquia. See our CALENDAR for the online meeting; open to everyone.


![]()
Issue: [Various]
Category: Mechanical, Electrical, Energy, Facility Asset Management
Colleagues: David Conrad, Richard Robben, Larry Spielvogel
A simple web search finds several articles and reports discussing how college and university presidents’ compensation (including base salary, bonuses, incentives, and total pay packages) can be linked—directly or indirectly—to success in building new facilities, capital projects, infrastructure development, or related fundraising/capital campaigns.
Nominally, while compensation may not be tied exclusively to constructing new buildings, many public and private institutions incorporate performance-based incentives (e.g., bonuses or deferred pay) connected to strategic goals like fundraising for capital campaigns, enrollment growth, research expansion, or completing major infrastructure initiatives. These often involve new facilities as key outcomes, since presidents frequently lead capital campaigns to fund buildings, renovations, or campus expansions. The topic comes up — tacitly — in annual compensation reviews .
Readings Pro & Con:
Overall, explicit ties to “building new facilities” are more common indirectly—through fundraising targets, capital campaign success, or strategic growth metrics—rather than line-item bonuses for specific construction projects. Critics argue this can incentivize flashy new builds over maintenance or academics, while proponents see it as aligning pay with institutional advancement. Compensation data often comes from sources like the Chronicle of Higher Education’s annual surveys or CUPA-HR reports.
Our coverage:
UNC-Chapel Hill announces plans to develop campus extension in Carolina North
The Vertical Density of Urban Apartments Is Catastrophic for Fertility
Could Bigger Apartments Reverse America’s Birth Decline?
Global Consistency in Presenting Construction & Life Cycle Costs
New Construction Release Schedule: https://www.census.gov/construction/c30/release.html
The next report will be released February 27th; possibly the result of government shutdowns. Given that the regular monthly cadence has been interrupted we will continue placing it on our first day of the month custom.
There’s been a significant redesign of the look and feel of the monthly Census Bureau reports construction activity. Today we sort through the rather more granular statistics that inform our recommendations for facility spend.
Total #construction activity for October 2025 ($2,175.2 billion) was 0.5% above September 2025 ($2,164.3 billion).
Learn more: https://t.co/vO6ZkjBJMY #CensusEconData #ConstructionSpending pic.twitter.com/CYux8HXJ3W
— U.S. Census Bureau (@uscensusbureau) January 21, 2026
December 1, 2025
It has been 20 years since we began tracking educational settlement facility spend. Starting this month we will examine federal government data together with the best available data about space utilization to enlighten our response to the perfectly reasonable question: “Are we over-building or under-building or building ineffectively”. Use the login credentials at the upper right of our home page.
United States: Schools of Architecture
The Society for College and University Planning (Ann Arbor, Michigan)
National Center for Education Statistics
The Financial Impact of Architectural Design: Balancing Aesthetics and Budget in Modern Construction
![]()
Homeschooling
2022 International Existing Building Code


 wiki tulane university")


As reported by the US Department of Commerce Census Bureau the value of construction put in place by August 2025 by the US education industry proceeded at a seasonally adjusted annual rate of $137.604 billion. This number does not include renovation for projects under 50,000 square feet and new construction in university-affiliated health care delivery enterprises. Reports are released two months after calendar month. The complete report is available at the link below:
MONTHLY CONSTRUCTION SPENDING August 2025 (released two months after calendar month)
Total construction activity for June 2025 ($2,136.2 billion) was 0.4 percent below the revised May 2025 estimate ($2,143.9 billion).
Learn more: https://t.co/ljpaYyKjuX#CensusEconData pic.twitter.com/TS6ewzZhc4
— U.S. Census Bureau (@uscensusbureau) August 1, 2025
This spend makes the US education facilities industry (which includes colleges, universities, technical/vocational and K-12 schools, most university-affiliated medical research and healthcare delivery enterprises, etc.) the largest non-residential building construction market in the United States after commercial property; and fairly close. For perspective consider total public + private construction ranked according to the tabulation most recently released:
$137.604 billion| Education Facilities
$155.728 billion | Power
$69.625 billion | Healthcare
Keep in mind that inflation figures into the elevated dollar figures. Overall — including construction, energy, custodial services, furnishings, security. etc., — the non-instructional spend plus the construction spend of the US education facilities is running at a rate of about $300 – $500 billion per year.
LIVE: A selection of construction cameras at US schools, colleges and universities
![]()
We typically pick through the new data set; looking for clues relevant to real asset spend decisions. Finally, we encourage the education facilities industry to contribute to the accuracy of these monthly reports by responding the US Census Bureau’s data gathering contractors.

Reconstruction of Ancient Agora
As surely as people are born, grow wealthy and die with extra cash,
there will be a home for that cash to sustain their memory and to steer
the cultural heritage of the next generation in beautiful settings.
![]()

More
National Center for Educational Statistics
AIA: Billings Index shows but remains strong May 2022
National Center for Education Statistics
Sightlines: Capital Investment College Facilities
OxBlue: Time-Lapse Construction Cameras for Education
US Census Bureau Form F-33 Survey of School System Finances
Global Consistency in Presenting Construction & Life Cycle Costs

United States National Weather Service
| Research Without Old Data and Old References |
Background: The use of older data and references is becoming increasingly disfavored for publication. A myopic focus on newer research risks losing sight of important research questions already addressed by now-invisible older studies. This creates a ‘Groundhog Day’ effect as illustrated by the 1993 movie of this name in which the protagonist has to relive the same day (Groundhog Day) over and over and over within a world with no memory of it. This article examines the consequences of the recent preference for newer data and references in current publication practices and is intended to stimulate new consideration of the utility of selected older data and references for the advancement of scientific knowledge.
Methods: Examples from the literature are used to exemplify the value of older data and older references. To illustrate the recency of references published in original medical research articles in a selected sample of recent academic medical journals, original research articles were examined in recent issues in selected psychiatry, medicine, and surgery journals.
Results: The literature examined reflected this article’s initial assertion that journals are emphasizing the publication of research with newer data and more recent references.
Conclusions: The current valuation of newer data above older data fails to appreciate the fact that new data eventually become old, and that old data were once new. The bias demonstrated in arbitrary policies pertaining to older data and older references can be addressed by instituting comparable treatment of older and newer data and references.
Related:
ASTM International: Standard Practice for Calculating and Using Basic Statistics
Groundhog Day: Ancient Origins of a Modern Celebration (Library of Congress)
IMSDb: “GroundHog Day” The Complete Script
Harvard Business Review: When the Groundhog Predicts an Early Spring, Investors Get Optimistic
Indiana University: Groundhog Day Probability in Perspective
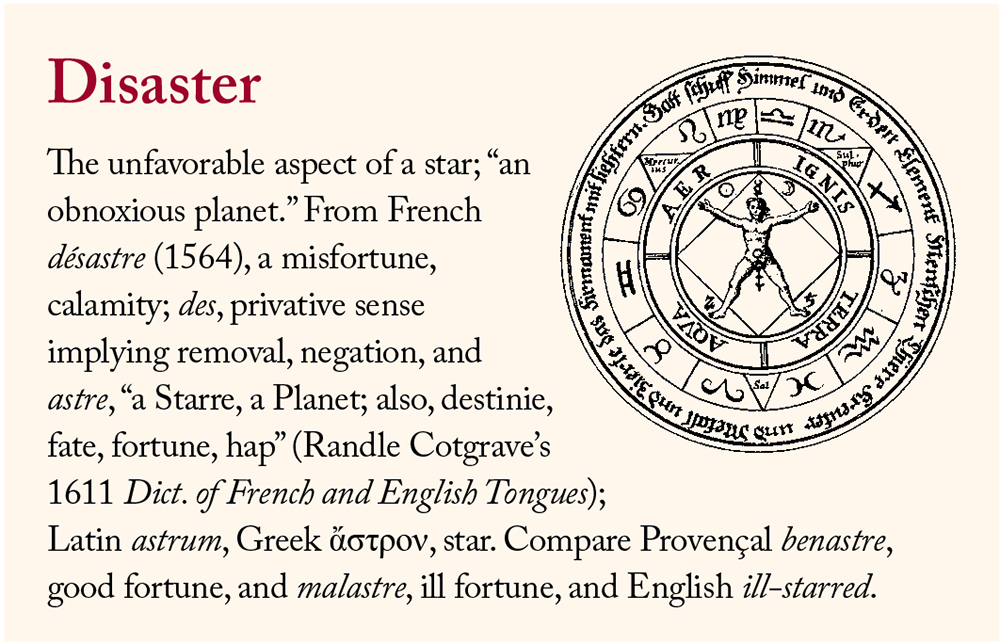
During today’s session we approach disaster avoidance, management and recovery literature from a different point of view than our customary approach — i.e. what happens when, a) there is failure to conform to the standard, b) there is no applicable standard at all. This approach necessarily requires venturing into the regulatory and legal domains.
Thinking about how that groundhog lied to us 🤨🤨🤨 pic.twitter.com/ZQOzzteCzs
— Penny Kmitt (@pennylikeacoin) April 4, 2024
We will confine our approach to the following standards development regimes:
We may have time to review State of Emergency laws on the books of most government agencies; with special attention to power blackout disasters.
Use the login credentials at the upper right of our home page.
https://t.co/chd9RJVc7G
print(“Disaster”) pic.twitter.com/Lu6Dw3bARq— Standards Michigan (@StandardsMich) November 15, 2021
New update alert! The 2022 update to the Trademark Assignment Dataset is now available online. Find 1.29 million trademark assignments, involving 2.28 million unique trademark properties issued by the USPTO between March 1952 and January 2023: https://t.co/njrDAbSpwB pic.twitter.com/GkAXrHoQ9T
— USPTO (@uspto) July 13, 2023
Standards Michigan Group, LLC
2723 South State Street | Suite 150
Ann Arbor, MI 48104 USA
888-746-3670
 |
 |
|
 |
 |
|
 |
 |

