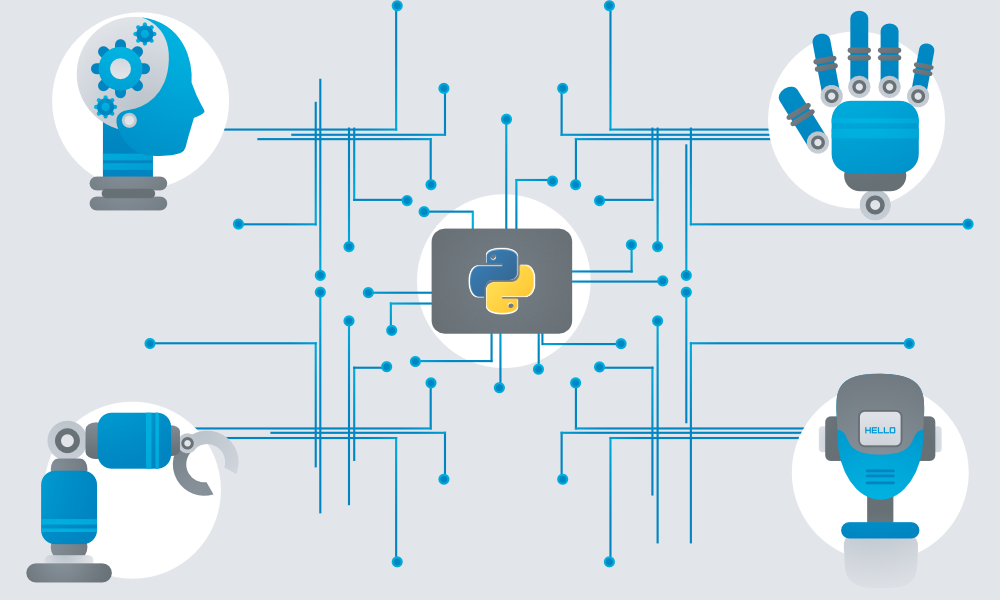
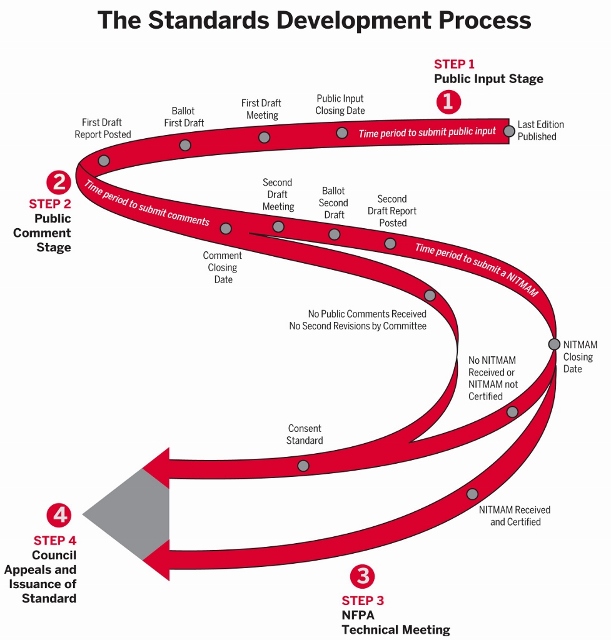
Open source standards development is characterized by very open exchange, collaborative participation, rapid prototyping, transparency and meritocracy. The Python programming language is a high-level, interpreted language that is widely used for general-purpose programming. Python is known for its readability, simplicity, and ease of use, making it a popular choice for beginners and experienced developers alike. Python has a large and active community of developers, which has led to the creation of a vast ecosystem of libraries, frameworks, and tools that can be used for a wide range of applications. These include web development, scientific computing, data analysis, machine learning, and more.
Another important aspect of Python is its versatility. It can be used on a wide range of platforms, including Windows, macOS, Linux, and even mobile devices. Python is also compatible with many other programming languages and can be integrated with other tools and technologies, making it a powerful tool for software development. Overall, the simplicity, readability, versatility, and large community support of Python make it a valuable programming language to learn for anyone interested in software development including building automation.
As open source software, anyone may suggest an improvement to Python(3.X) starting at the link below:
Python can be used to control building automation systems. Building automation systems are typically used to control various systems within a building, such as heating, ventilation, air conditioning, lighting, security, and more. Python can be used to control these systems by interacting with the control systems through the building’s network or other interfaces.
There are several Python libraries available that can be used for building automation, including PyVISA, which is used to communicate with instrumentation and control systems, and PyModbus, which is used to communicate with Modbus devices commonly used in building automation systems. Python can also be used to develop custom applications and scripts to automate building systems, such as scheduling temperature setpoints, turning on and off lights, and adjusting ventilation systems based on occupancy or other variables. Overall, Python’s flexibility and versatility make it well-suited for use in building automation systems.
.@PyCon US 2025 is a wrap, and our hearts are full with #Python community love! Thanks to every single one of you who organized, volunteered, attended, & sponsored 🐍🫶 #PyConUS
The PSF office will be closed May 26-28 so our staff can rest & recover. See you back online soon! pic.twitter.com/Sy1hiRmvw4
— Python Software Foundation (@ThePSF) May 27, 2025
Passages from Chinese literature about “social practice”:
• From the Book of Rites (《礼记》), a Confucian classic:
“慎始以為客,礼之至也。一日以为主,恩之至也。”
Translation: “To treat a guest with caution and respect is the height of ritual. To treat a guest as if he were one’s own master for a day is the height of kindness.”
This passage emphasizes the importance of hospitality as a key aspect of ritual and ethical behavior. It suggests that treating guests with respect and kindness is not only a matter of good manners, but also a reflection of one’s character and values.
• From “Journey to the West” (《西游记》), a classic Chinese novel:
“人情好客,至乐莫甚。”
Translation: “There is no greater pleasure than being hospitable and friendly to others.”
This passage highlights the joy and fulfillment that comes from showing hospitality and kindness to others. It suggests that the act of hosting and welcoming guests can bring happiness and satisfaction to both the host and the guest.
• From “The Analects” (《论语》), a collection of sayings and teachings attributed to Confucius:
“舍尔其为人也,尽礼而已。”
Translation: “When you host someone, treat them with the utmost respect and courtesy.”
Today we break down the catalog for food safety in education communities; with primary attention to consultations from private standard developing organizations and federal agencies charged with food safety. We do so with sensitivity to animals and plants and sustainability of the global food supply chain. Many schools are the communal cafeterias for the communities that own and operate them and run at commercial scale.
We prepare responses to public consultations released by standards developing organizations which, in many cases, have significant conformance enterprises. Core titles are published by the ANSI accredited organizations listed below:
The ASHRAE catalog is the most cross-cutting and fastest moving catalog in the land. If you claim ownership of the United States energy domain you pretty much capture everything related campus safety and sustainability. Best to deal with it on a day-by-day basis as we usually do according to daily topics shown on our CALENDAR.
Association for Packaging and Processing Technologies
National Electrical Safety Code (Our particular interest lies in the safety and reliability of off-campus agricultural and research facilities that receive power from regulated utilities)
Commercial Cooking, Rethermalization and Powered Hot Food Holding and Transport Equipment
Commercial Powered Food Preparation Equipment
Manufacturers are required to meet the NEC and CEC electrical codes to have their food equipment sold and used in the United States and Canada. Watch our video for more details. pic.twitter.com/d0vUf4zUl2
Food safety and sustainability standards populate are of the largest domains we track so if we need a break0-out session, let’s do it. Use the login credentials at the upper right of our home page.
University of Kentucky College of Agriculture, Food and Environment
MSU’s relationship with @Pewabic dates back to the 1920s, when Pewabic tile began to appear throughout campus.
Years later, MSU absorbed Pewabic for a short period of time as they transitioned from a production pottery to an educational facility to help ensure their future. pic.twitter.com/SsebtJOjlx
Not every student is passionate about Graph Algorithms, Green Policy or coding the Internet of Things but wants to devote their energy and talent to making the world a better place by making the world a more beautiful place. Spaces for the “creatives” among them are elevated risk spaces. Today we examine the literature for designing, building and maintaining these occupancies in the safest and most sustainable way; among them the spaces for textile research and fashion design; usually co-mingled with drawing, painting, and textile creation space.
The garment industry is multi-disciplinary and is larger than the energy industry. It contributes to the standard for civilization; even though subtly so. For this reason, starting 2023, we will break down our coverage of the literature that supports the fashion industry from the fine arts domain in separate colloquia every quarter.
Fine Arts 200. Exploration of best practice for spaces used for various forms of creative expression that are appreciated for their artistic or aesthetic value, often involving skills and techniques that require specialized training and expertise.
Painting: The application of pigment to a surface, such as canvas or paper, to create images or visual compositions using techniques like oil, acrylic, watercolor, or tempera.
Sculpture: The creation of three-dimensional artworks by shaping and manipulating materials such as stone, wood, metal, or clay.
Drawing: The use of lines, marks, or other materials to create images or representations on paper, canvas, or other surfaces.
Printmaking: The creation of multiple copies of an image from a master plate or block, using techniques like engraving, etching, lithography, or screen printing.
Photography: The use of a camera to capture and create visual images, often through techniques such as exposure, composition, and processing.
Architecture: The design and construction of buildings and structures, involving artistic elements such as form, space, materials, and aesthetics.
Ceramics: The creation of pottery or ceramic objects using techniques like wheel throwing, hand-building, or glazing.
Mixed media: The combination of different artistic materials or techniques in a single artwork, such as collage, assemblage, or installations.
Conceptual art: The creation of artworks that prioritize ideas, concepts, and intellectual or philosophical aspects over traditional aesthetic or material considerations.
Fashion 300. Best practice literature for the spaces needed for the creation of artworks using textiles and fibers, such as weaving, quilting, or embroidery. Research and teaching spaces in this domain; at the foundation of the garment industry — one of the largest sectors in the economy in any nation — present surprising challenges
Commercial kitchens offer several benefits, such as efficient food preparation and large-scale production, allowing businesses to meet high demand. They provide professional-grade equipment and ample space, enabling chefs to explore culinary creativity. Commercial kitchens also promote hygiene and food safety standards, with dedicated cleaning protocols and inspections. However, hazards can arise from the high-temperature cooking equipment, sharp tools, and potentially hazardous substances. There is also a risk of burns, slips, and falls, emphasizing the importance of proper training and safety measures. Adequate ventilation and fire safety systems are vital to prevent accidents and maintain a healthy working environment.
Public hearings on the proposed changes happen in Orlando, April 7-16.
This is a summary of the actions taken on the 2024 Comments on Proposed Changes to the ICC International Codes at the October 23-28, 2024 Committee Action Hearings #2 held at the Long Beach Convention Center, Long Beach, California. Balloting of local building code officials is now underway.
Welcome to the future: robot chef whips up tasty meals at FIU | FIU News – Florida International University https://t.co/IE4qDASlJv
Books cannot be killed by fire. People die, but books never die
No man and no force can put thought in a concentration camp forever
— Franklin Roosevelt
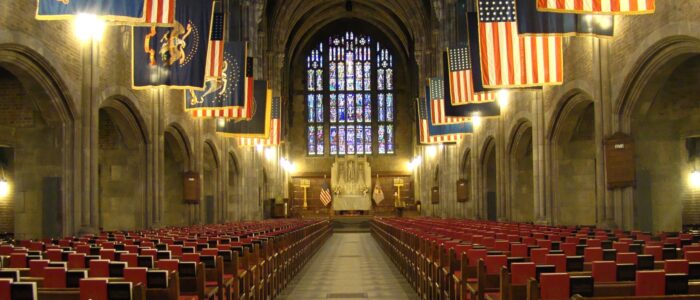
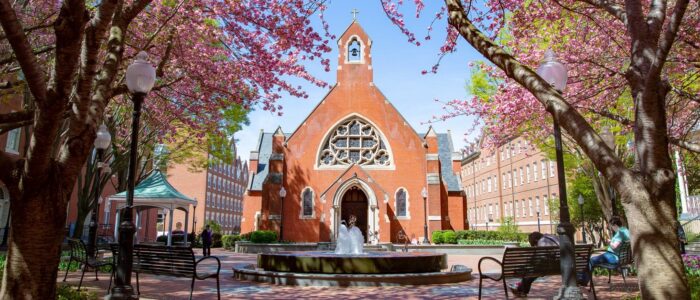
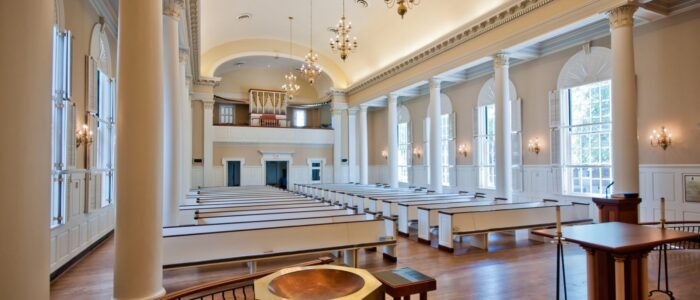
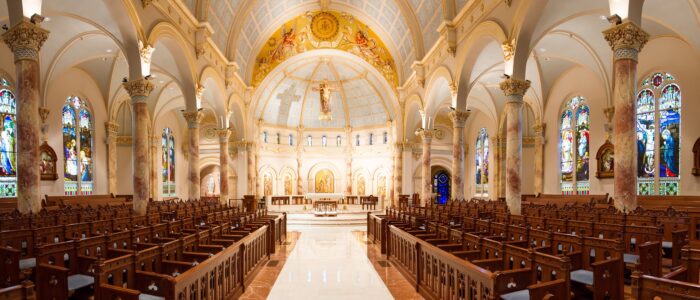
Many education communities build and maintain cultural resource properties whose safety and sustainability objectives are informed by local adaptations of consensus products developed by the International Code Council (ICC) and the National Fire Protection Association (NFPA). We need to understand the ICC and NFPA product suites as a pair. For most real assets in the education industry they move “roughly” in tandem even though they are produced by different organizations for a different set of customers. Sometimes the out-of-step condition between NFPA and ICC permits subject matter experts on technical committees to make the best possible decisions regarding the safety and sustainability agenda of the interest group they represent; but not always.
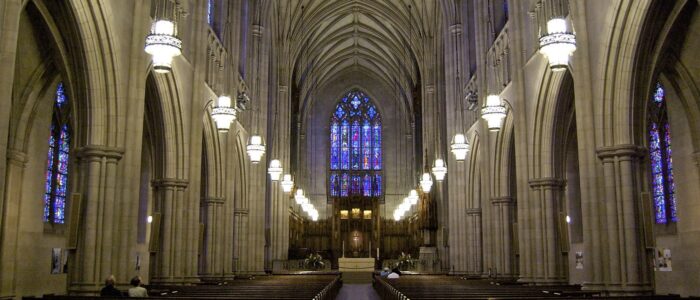
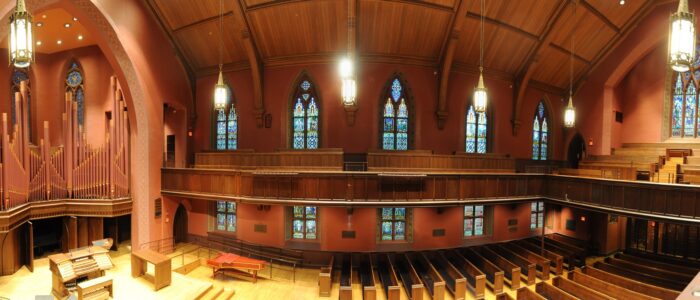
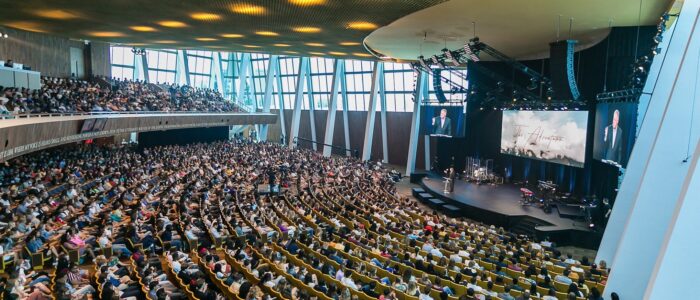
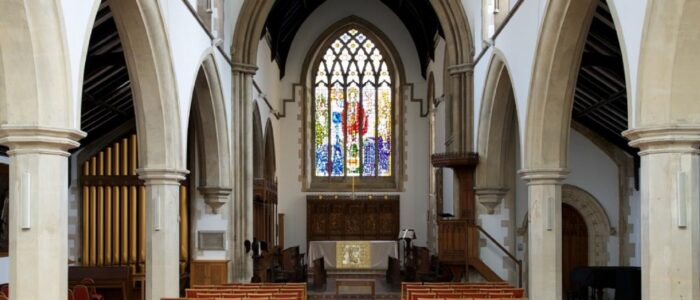
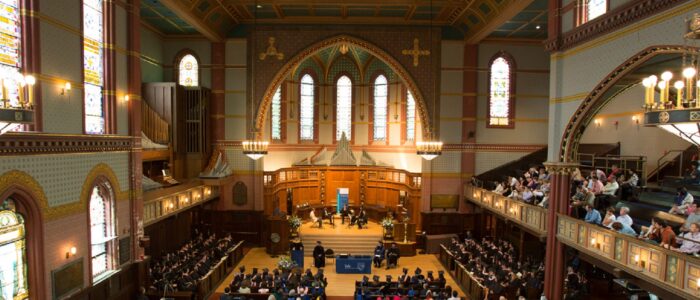
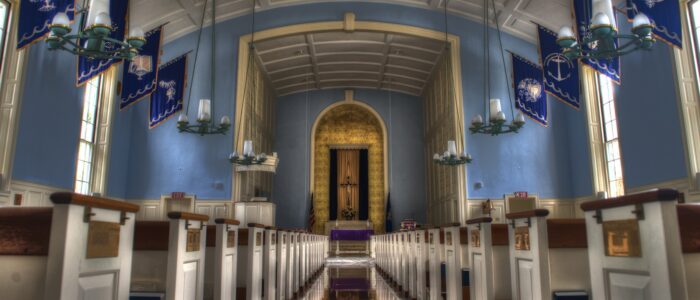
Occupancy classification is always a first consideration and both the NFPA and the ICC have a claim to some part of this occupancy concept*. In the ICC suite we find code requirements for many “cultural places of worship” tracking in the following sections of the International Building Code (IBC):
Note that Sections 305 and 308 recognize the accessory and multi-functional nature of occupancy types in the education industry – i.e child care and adult care function can marge and be an accessory to a place of worship. The general rule in the IBC is that accessory religious educational rooms and religious auditoriums with occupant loads of less than 100 per room or space are not considered separate occupancies. Other standards developers are guided by this rule.
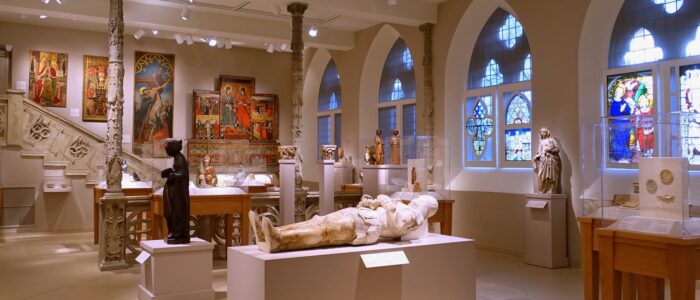
• This code describes principles and practices of protection for cultural resource properties (including, but not limited to, museums, libraries, and places of worship), their contents, and collections, against conditions or physical situations with the potential to cause damage or loss.
• This code covers ongoing operations and rehabilitation and acknowledges the need to preserve culturally significant and character-defining building features and sensitive, often irreplaceable, collections and to provide continuity of operations.
• Principles and practices for life safety in cultural resource properties are outside the scope of this code. Where this code includes provisions for maintaining means of egress and controlling occupant load, it is to facilitate the evacuation of items of cultural significance, allow access for damage limitation teams in an emergency, and prevent damage to collections through overcrowding or as an unintended consequence of an emergency evacuation.
• Library and museum collections that are privately owned and not open to the public shall not be required to meet the requirements of this code.
Since we are hard upon release of the 2021 Edition of NFPA 909 let us take a backward look at the current (2017) version of NFPA 909 Code for the Protection of Cultural Resource Properties – Museums, Libraries, and Places of Worship. Chapter 14 covers “Museums, Libraries and their Collections”. Chapter 15 covers “Places of Worship”
The 2025 Edition is now open for public input. Let us pick through proposals for the 2021 Edition to inform our approach to its improvement by referencing the technical committee transcripts linked below:
N.B. We find committee response (accepted in principle) to Standards Michigan proposal to articulate conditions in which places of worship and libraries are used as community disaster relief support facilities. We consider this a modest “code win”.
Circling back to the ICC suite we find elevated interest in hardening community owned facilities to tornadoes, hurricane and floods and other storm related risk in the structural engineering chapters of the International Building Code.
Leadership and facility managers for enterprises of this type are encouraged to contribute obtain their own (free) NFPA public participation account in order to directly participate in the 2025 revision of NFPA 909 by logging in here: https://www.nfpa.org/login.
Public consultation on the First Draft of the 2025 Edition closes January 4, 2024.
This document is also a standing item on our periodic Prometheus, Lively and Fine Arts teleconference. See our CALENDAR for the next online meeting; open to everyone.
Guidelines for the Security of Rare Books, Manuscripts, and Other Special Collections,Association of College & Research Libraries, American Library Association, 50 East Huron Street, Chicago, IL 60611-2795.
“A Legal Primer on Managing Museum Collections,”Malaro, Marie, second edition 1998
“Risk and Insurance Management Manual for Libraries,”Mary Breighner and William Payton, edited by Jeanne Drewes, ALA 2005 ISBN 0-8389-8325-1.
Wisconsin Historic Building Code, Madison, WI:Wisconsin Administrative Code.
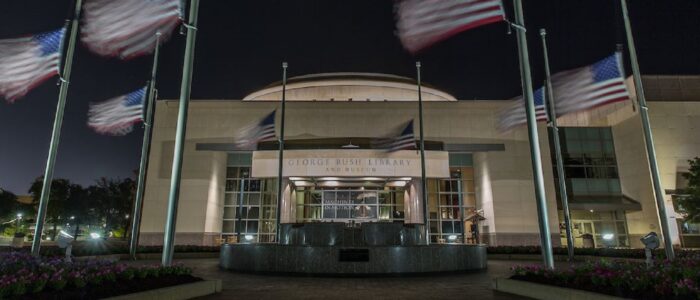
Several universities host federal enterprises (laboratories, wildlands, Presidential libraries*, etc.) that must conform to Title 40 United States Code, Public Buildings, Property, and Works Paragraph 486(c)provides statutory authority for the head of each executive agency to issue orders and directives necessary to manage the Government’s property.
The first elevator in the United States was installed at Harvard University in 1874. It was not a passenger elevator as we typically think of today, but rather a freight elevator used to move heavy items within a building. The installation of this elevator marked an important development in building technology and transportation within multi-story structures. It was based on the design of Elisha Otis, who is famous for inventing the safety elevator with a safety brake system that prevents the elevator from falling if the hoisting cable fails. Otis’ innovation played a pivotal role in making elevators safe and practical for everyday use, leading to their widespread adoption in buildings around the world.
Elevator design by the German engineer Konrad Kyeser (1405)
Education communities are stewards of 100’s of lifts, elevators and moving walks. At the University of Michigan, there are the better part of 1000 of them; with 19 of them in Michigan Stadium alone. The cost of building them — on the order of $50,000 to $150,000 per floor depending upon architectural styling — and the highly trained staff needed to operate, maintain and program interoperability software is another cost that requires attention. All building design and construction disciplines — architectural, mechanical and electrical have a hand in making this technology safe and sustainabile.
We start with international and nationally developed best practice literature and work our way to state level adaptations. Labor for this technology is heavily regulated.
Its a rarefied and crazy domain for the user-interest. Expertise is passionate about safety and idiosyncratic but needs to be given the life safety hazard. Today we review o pull together public consultation notices on relevant codes, standards and regulations today 11 AM/EDT.
BOMA International sets the standard for measuring buildings. In 1915, BOMA published its first office standard, Standard Method of Floor Measurement. Throughout the years, the standard has been revised to reflect the changing needs of the real estate market and the evolution of office building design.
BOMA International is the American National Standards Institute (ANSI) secretariat for a suite of area measurement standards.
The BOMA catalog remains active, with recent revisions reflecting changes in building use, energy accounting and increasingly complicated mixed-use occupancies.
Government capital aid for schools is usually capped by classified building type and measured area. States sort facilities by grade band (elementary, middle, high school) and program (special education, CTE), then apply published gross-square-foot-per-student allowances.
.
Eligible size is typically gross area to the exterior walls; circulation, walls, and mechanical space are included via net-to-gross markups. Only that baseline is state-funded; extra square footage is a local cost. Misclassification or a different measurement method (net vs. gross, interior vs. exterior) changes the funded envelope and can cut or inflate aid.
.
Higher-education inventories often use FICM assignable-versus-gross rules for similar reporting and reimbursement. K-12 inventories take into account stairs, voids, mechanical rooms, portables, and renovations. So classification plus the chosen measurement method can change what is eligible for public money.
At the moment all titles in this catalog seem to be stabilized. Largely because a sizeable portion of square footage in every school district, college, university and university-affiliated healthcare research and clinical delivery system derives at least part of its funding from governments at all levels there are workgroups devoted to measuring square footage and documenting its use. For example:
Getting square-footage right is essential for securing an organization’s sustainability and “green” claims for example. The links in previous posts provide for information about future public consultations.
We maintain the BOMA catalog on the agenda of our Space Planning, Hammurabi and Architectural colloquia, hosted 6 to 8 times annually. See our CALENDAR for the next online meeting, open to everyone.
We drill into the specifics commonly found in education communities: sub-lease of space to private industry in publicly-owned facilities. The Building Owners and Managers Association International is an ANSI-accredited consensus standard developer and revised its standard — BOMA Z65.5 Retail Properties: Standard Method of Measurement. Measuring the area of a retail building can quickly become complex when variables must be considered such as ancillary space, mezzanines and storefront lease lines. Many large research universities have long since leased space within many of their building envelopes for private industry to service their communities — student unions, hospitals, dormitories and athletic venues, for example. From the project prospectus:
Z65.5 is intended exclusively for retail properties and their associated structures and may be applied to single-tenant, multi-tenant or multi-building configurations. It features a single method of measurement, with two levels of measurement data, known as Partial Measurement and Overall Measurement for retail properties. It does not measure sidewalks, surface parking, drainage structures, or other ancillary site improvements. This standard is chiefly designed to generate Gross Leasable Area figures, a key metric in retail leasing; however, it also produces area figures which may be of interest to those examining space utilization, valuation, benchmarking, and the allocation of building expenses to various cost centers. The scope of this standard is not intended to be submitted for consideration as an ISO, IEC, or ISO/IEC JTC-1 standard.
Public consultation is open until February 8th.
You may obtain an electronic copy from: floorstandards@boma.org. Send comments (with optional copy to psa@ansi.org) to: floorstandards@boma.org. We encourage user-interest subject matter experts in education facility management to participate directly in the BOMA standards development process by communicating directly with Tanner Johnson at BOMA (tjohnston@boma.org) or 202-326-6357 for more information.
We keep the BOMA catalog on the standing agenda of our colloquia devoted to building construction best practice. See our CALENDAR for the next online meeting; open to everyone.
– To promote an unambiguous framework for determining the areas of Industrial Buildings with a strong focus on Rentable Area calculations;
– To facilitate transparency and clear communication of building measurement concepts among all participants in the commercial real estate
industry;
– To allow a comparison of values on the basis of a clearly understood and generally agreed upon method of measurement; and
– To align concepts and measurement methodologies with the International Property Measurement Standards: Industrial Buildings (January 2018)
document.
Send comments (with optional copy to psa@ansi.org) to: tjohnston@boma.org
Standards Michigan follows, but d0es not advocate in most of the BOMA standards suite for the following reasons:
Educational facility occupancies are fairly well accounted for in existing federal and state regulations
Advocacy in energy-related best practice titles are a better use of resources at the moment.
We encourage user-interest subject matter experts in education facility management to participate directly in the BOMA standards development process by communicating directly with Tanner Johnson at BOMA (tjohnston@boma.org) or 202-326-6357 for more information.
We maintain the entire BOMA suite on our periodic Model Building Code colloquia. See our CALENDAR for the next online meeting; open to everyone.
Issue: [15-200]
Category: Architectural, Space Plaaning, Facility Asset Management
New update alert! The 2022 update to the Trademark Assignment Dataset is now available online. Find 1.29 million trademark assignments, involving 2.28 million unique trademark properties issued by the USPTO between March 1952 and January 2023: https://t.co/njrDAbSpwBpic.twitter.com/GkAXrHoQ9T




















.jpg)